Abstract
This analysis aims to answer whether grades and importance placed on grades are associated with self-esteem among secondary school students. Using data collected in 1992–1993 from the Alfred P. Sloan Study of Youth and Social Development, potential odds models were constructed to predict self-reported self-worth. Four models were constructed: a base model using only report card grades and grades' importance as predictors and three models built on the base model each with a category of confounding variables (identities, external pressures, and frequency of requests for deeper understanding), reduced by backwards stepwise selection according to the Akaike information criterion. An association between importance placed on grades and self-esteem was not demonstrated. A positive association between non-failing grades and self-esteem was demonstrated. In aiding prediction, external pressures were more helpful than identities, which were more helpful than frequency of deeper understanding requests. Race, gender, community economic class, the importance of grades to friends, familial expectations, and requested deeper understanding in history all significantly contributed to prediction. Further research and analysis is encouraged.
Introduction
Adolescence is marked by rapid changes in self-image. Given that the typical adolescent is in school, it makes sense that there has been much research on the effects of self-esteem on academic performance. There is general academic consensus that greater self-esteem has a positive impact on academic performance (Richardson 2012, Lane et al 2004), though there have been studies with differing conclusions (Thompson 1994, Forsyth et al 2007). There is additional research that suggests that this relationship may be reciprocal (Marsh & Martin 2011). This latter perspective, of attempting to understand what factors bolster self-esteem, prioritizes the student and their well-being rather than their output.
This analysis will attempt to answer whether grades and importance placed on grades are associated with self-esteem among secondary school students. There is evidence that this relationship may be impacted by gender (Pomerantz et al 2002), race (Lay & Wakstein 1985), economic class (Muijs 1997), teacher-student and parent-child relationships (Martin et al 2007), the values of friends (Wouters et al 2013), and how academic success is defined (Marsh et al 1991). As such, I will investigate these as confounding or assisting predictor variables.
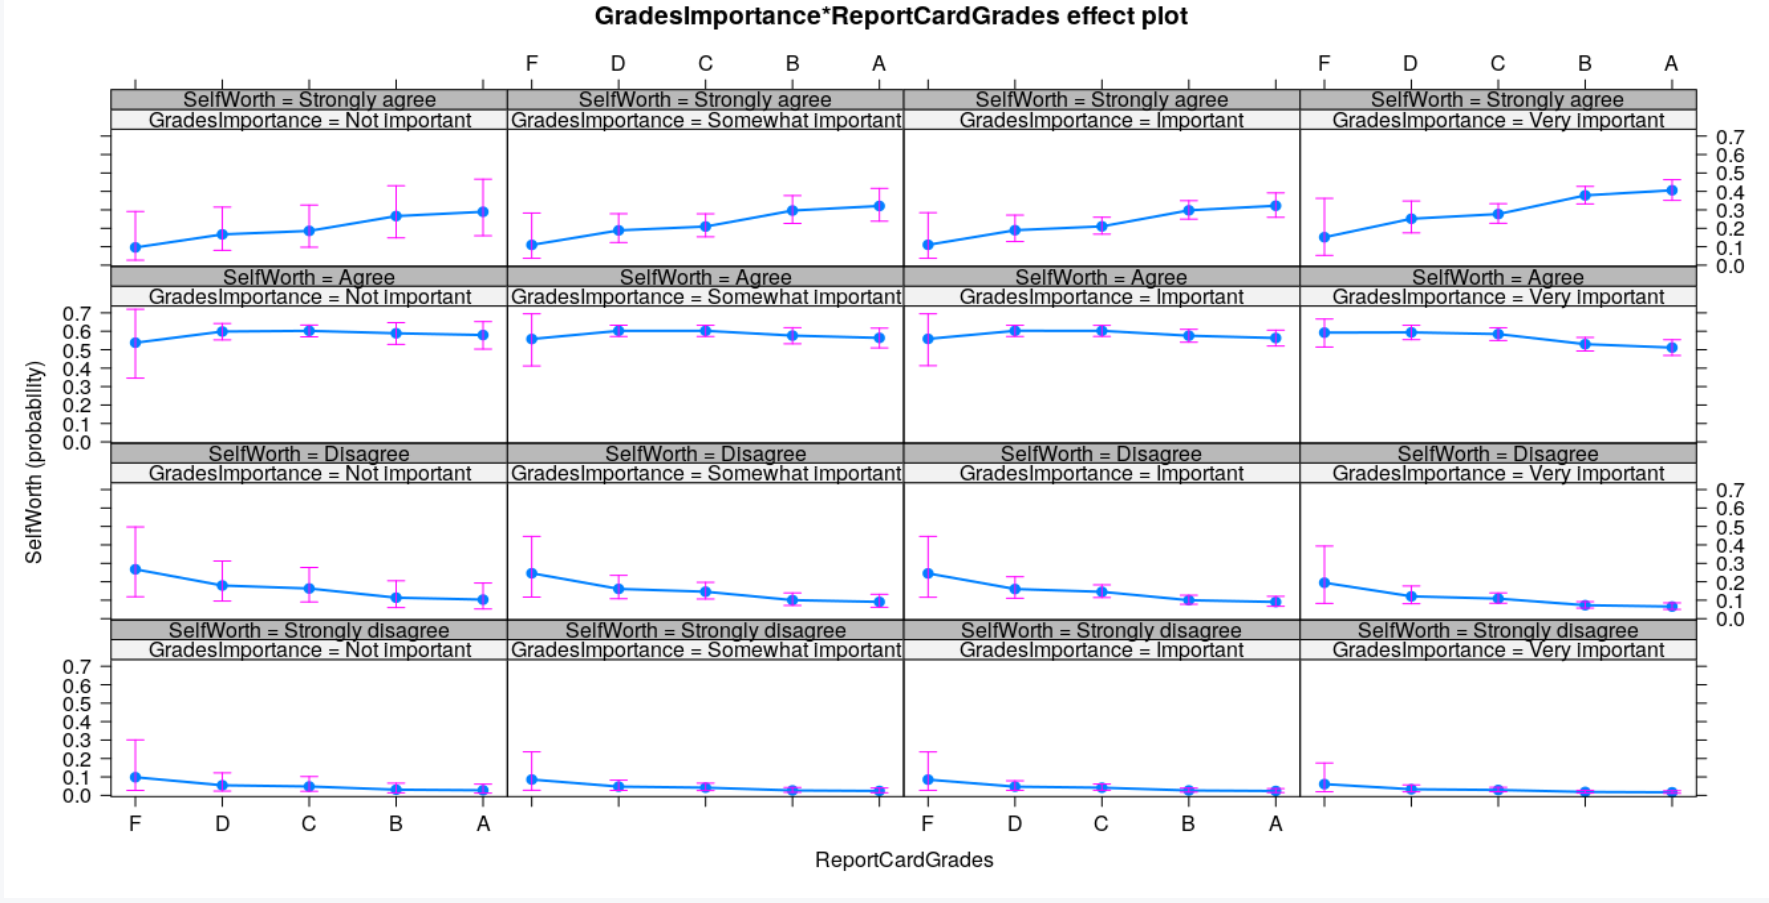
It is important to note that the focus of my investigation is not just on if academic achievement has a significant effect on self-worth, but also if the importance of academic achievement to the student is significant. While these variables are related, it is important to remember that a studious student is not necessarily an academically successful one. The interaction of these two variables is also important. Academic excellence may not be as important for self-image for a student who does not find it important than for a student who does. Conversely, a student who receives exceptional grades may factor grades to a greater extent in their self-image.
Methods
The data used in this analysis were collected from the Alfred P. Sloan Study of Youth and Social Development. The data were collected from 12 sites (encompassing 33 schools: 20 middle schools and 13 high schools), which have large geographic, socioeconomic, and racial variation between them (Schneider 2013). I used the Year 1 cohort sample, composed of 2951 participants in 1992–1993. This was filtered down to 1212 participants after removing participants with absent data for the relevant variables.
The outcome variable is self-worth, measured as how much respondents agreed (strongly disagree, disagree, agree, strongly agree) to the statement “I feel I am a person of worth, the equal of other people”. The two main predictor variables were the grades of the respondent and the importance of grades to the respondent. The former was measured by the answers (not important, somewhat important, important, very important) to the question “How important are good grades to you?” while the latter was measured by self-reports of the respondent's dominant letter grade (A, B, C, D, F; those who answered half-and-half of two grades were counted under the lower grade to allow for greater spread).
Confounding variables were grouped into three categories: identities (race, gender, grade year, economic class of community), external pressures (importance of grades to friends, whether the respondent's family expected their best, whether the respondent attempts to make their family proud, how strict they view school rules), and how often deeper understanding of course material was asked of the respondent in each major subject (math, science, history, English).
R was utilized for all statistical analysis. Histograms, both of individual variables and of self-worth within factors of predictor variables, were used for exploratory analysis. As the response variable is ordinal, the data was interpreted through proportional odds models, created using the MASS package. The proportional odds assumption was assessed using the pomcheckr package. The assumption generally holds for all main and confounding predictor variables. Statistical significance (α=0.05) was assessed using likelihood ratio tests from the lmtest package. Model fitness was assessed using the Akaike information criterion (AIC). Multicollinearity was assessed through analyzing the variance inflation factor using the car package. No significant (VIF>5) multicollinearity was identified in any model. Main effects plots, created with the effects package, were used to visualize data.
A base model was constructed with the two main predictor variables. A second base model was constructed with the addition of an interaction term of the two main predictor variables. Three models were constructed using all confounding variables in each category with the main predictor variables. The three models were then reduced through backwards stepwise selection according to AIC, with the base model as the lower model. An interaction term of the two main predictor variables was added if statistically significant as deemed by the likelihood ratio test.
Results
Self-worth is heavily skewed, with 56% of students responding “agree” and 31% responding “strongly agree”, compared to 10% responding “disagree” and 3% responding “strongly disagree”. Grades' importance is similarly skewed, with 54% of students ranking good grades as “very important” and 31% as “important”, compared 12% as “somewhat important” and 3% as “not important. Report card grades are skewed but to a lesser extent: 24% are A students, 42% are B students, 26% are C students, 7% are D students, and 1% are F students.
The base model has an AIC of 2441, less than either grades' importance (AIC=2455) or grades (AIC=2446) individually. The base model is a significant inclusion over a null model according to the likelihood ratio test (p < 0.001). The odds ratio of “somewhat important” over “not important” is 1.42 (95% CI: 0.86–2.35), the odds ratio of “important” over “somewhat important” is 1.11 (95% CI: 0.73–1.69), and the odds ratio of “very important” over “important” is 1.12 (95% CI: 0.83–1.52) — adjusted for report card grades. This indicates that increases in grades' importance are not associated with changes in self-worth — adjusted for report card grades. The odds ratio of D's and above over F's is 2.82 (95% CI: 1.31–5.98), the odds ratio of C's and above over D's and below is 0.83 (95% CI: 0.44–1.59), the odds ratio of B's and above over C's and below is 1.05 (95% CI: 0.66–1.67), and the odds ratio of A's over B's and below is 0.83 (95% CI: 0.62–1.13) — adjusted for grades' importance. This indicates that having at least D's or higher is associated with an increase in self-worth, but other relations are statistically insignificant — adjusted for grades' importance. An interaction term between grades' importance and report card grades is not a statistically significant inclusion to the model according to the likelihood ratio test (p = 0.158).
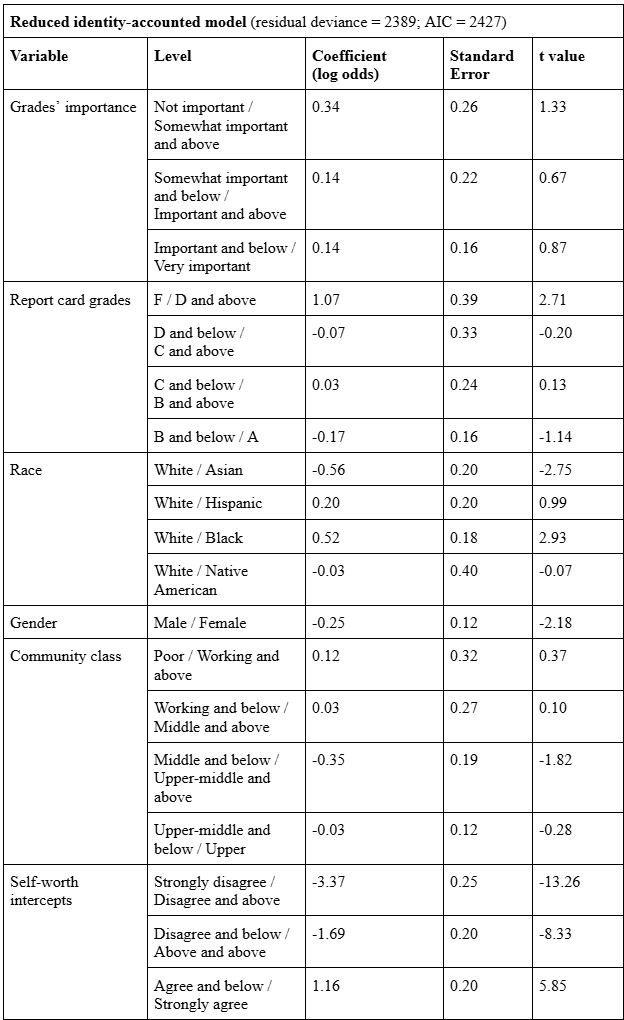
The reduced identity-accounted model has an AIC of 2427, lower than the base model. The model is constructed from grades' importance, report card grades, race, gender, and community economic class. These additional identity variables are statistically significant inclusions to the model, according to the likelihood ratio test (p < 0.001). An interaction term between grades' importance and report card grades is not a statistically significant inclusion to the model, according to the likelihood ratio test (p = 0.057).
When accounting for these identities, the significance of the report card grades and grades' importance remains similar. The odds ratio of “somewhat important” over “not important” is 1.41 (95% CI: 0.85–2.35), the odds ratio of “important” over “somewhat important” is 1.15 (95% CI: 0.76–1.76), and the odds ratio of “very important” over “important” is 1.14 (95% CI: 0.84–1.55). This again indicates that increases in grades' importance are not associated with changes in self-worth, adjusted for identities and report card grades. The odds ratio of D's and above over F's is 2.91 (95% CI: 1.33–6.28), the odds ratio of C's and above over D's and below is 0.93 (95% CI: 0.49–1.81), the odds ratio of B's and above over C's and below is 1.03 (95% CI: 0.64–1.65), and the odds ratio of A's over B's and below is 0.84 (95% CI: 0.62–1.14). This again indicates that having at least D's or higher is associated with an increase in self-worth, but other relations are statistically insignificant, adjusted for identities and grades' importance.
Race is associated with some significant differences: the odds ratio of Asians over Whites is 0.57 (95% CI: 0.38–0.85), Hispanics over Whites is 1.22 (95% CI: 0.82–1.81), Blacks over Whites is 1.68 (95% CI: 1.19–2.37), and Native Americans over Whites is 0.97 (95% CI: 0.44–2.13) — adjusted for other identities, report card grades, and grades' importance. Gender is also significant: the odds ratio of girls over boys is 0.78 (95% CI: 0.62–0.98) — adjusted for other identities, report card grades, and grades' importance. The economic class of the community was not significant: the odds ratio of poor vs all higher classes was 1.15 (95% CI: 0.61–2.17), for poor and working class vs higher classes was 1.02 (95% CI: 0.60–1.74), for lower classes vs upper-middle and upper class was 0.73 (95% CI: 0.50–1.07), and for lower classes vs upper class was 0.98 (95% CI: 0.77–1.25) — adjusted for other identities, report card grades, and grades' importance.
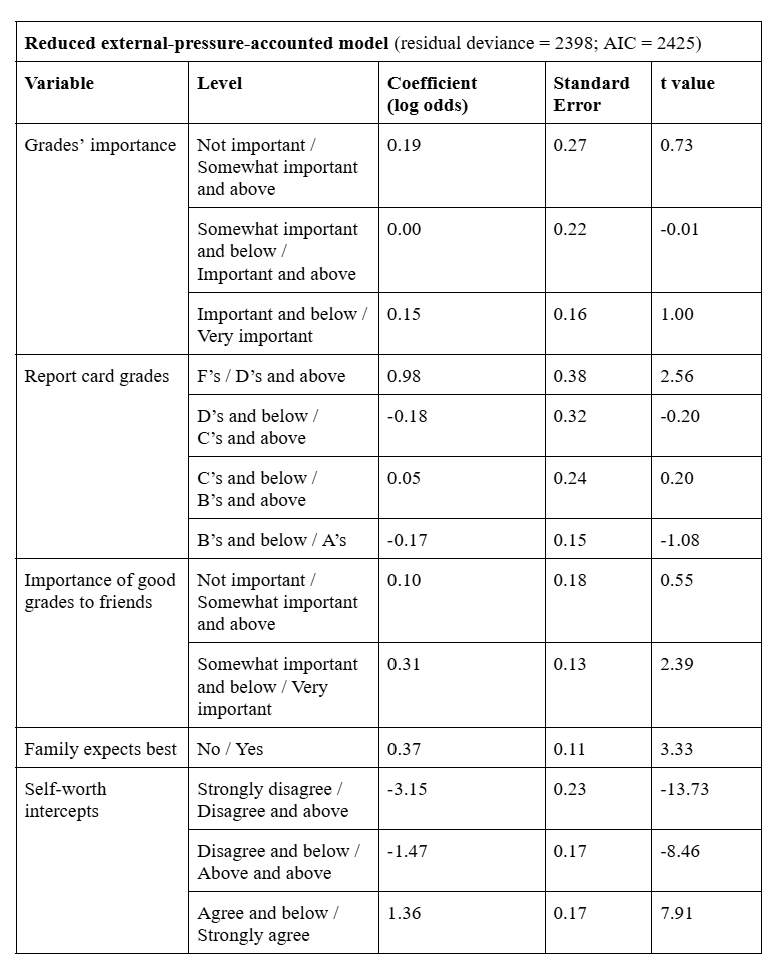
The reduced model that takes into account external pressures has an AIC of 2425, lower than both the identity-accounted model and the base model. The model is constructed from grades' importance, report card grades, the importance of grades to friends, and if family expects the best from the respondent. These additional identity variables are statistically significant inclusions to the model, according to the likelihood ratio test (p < 0.001). An interaction term between grades' importance and report card grades is not a statistically significant inclusion to the model, according to the likelihood ratio test (p = 0.246).
When accounting for external pressures, the significance of the report card grades and grades' importance is similar. The odds ratio of “somewhat important” over “not important” is 1.22 (95% CI: 0.72–2.06), the odds ratio of “important” over “somewhat important” is 1.00 (95% CI: 0.65–1.52), and the odds ratio of “very important” over “important” is 1.17 (95% CI: 0.86–1.59). This again indicates that increases in grades' importance are not associated with changes in self-worth, adjusted for pressures and report card grades. The odds ratio of D's and above over F's is 2.66 (95% CI: 1.25–5.59), the odds ratio of C's and above over D's and below is 0.83 (95% CI: 0.44–1.59), the odds ratio of B's and above over C's and below is 1.05 (95% CI: 0.66–1.66), and the odds ratio of A's over B's and below is 0.85 (95% CI: 0.63–1.15), adjusted for pressures and grades' importance. This again indicates that having at least D's or higher is associated with an increase in self-worth, but other relations are statistically insignificant.
The importance of grades to friends was somewhat significant: the odds ratio of “somewhat important” over “not important” is 1.11 (95% CI: 0.77–1.59) while the odds ratio of “important” to “somewhat important” is 1.36 (95% CI: 1.06–1.74) — adjusted for family expectations, report card grades, and grades' importance. Family expectations were significant: a respondent's family expecting best over not expecting best has an odds ratio of 1.45 (95% CI: 1.16–1.80) — adjusted for importance of grades to friends, report card grades, and grades' importance.
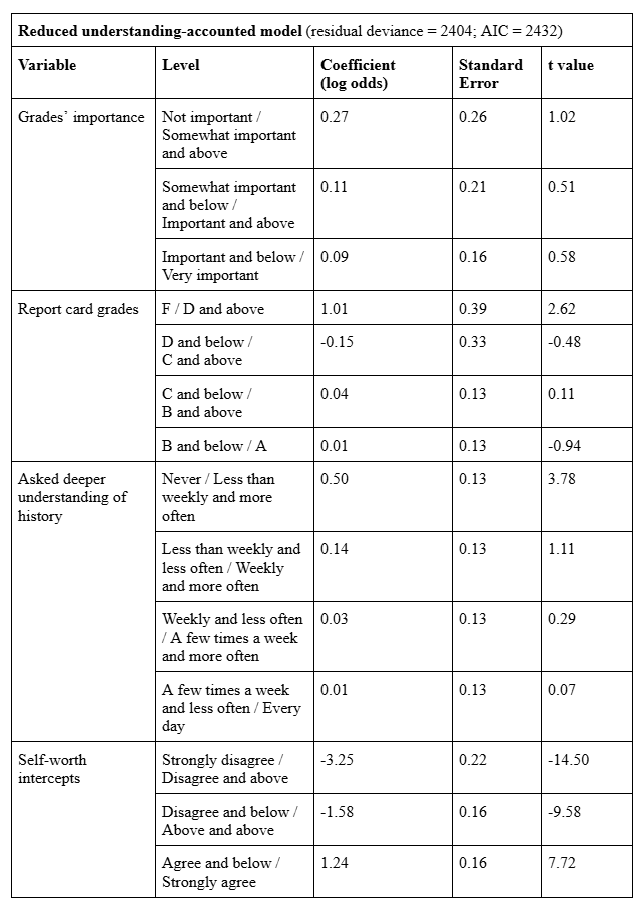
The reduced model that takes into account if students are asked for deeper understanding has an AIC of 2432, lower than the base model but higher than the identity-accounted model and the pressure-accounted model. The model is constructed from grades' importance, report card grades, and the frequency of requests for deeper understanding in history class. This additional variable is a statistically significant inclusion to the model, according to the likelihood ratio test (p = 0.002). An interaction term between grades' importance and report card grades is not a statistically significant inclusion to the model, according to the likelihood ratio test (p = 0.147).
When accounting for the frequency of requests for deeper understanding in history class, the significance of the report card grades and grades' importance is similar. The odds ratio of “somewhat important” over not important is 1.30 (95% CI: 0.79–2.19), the odds ratio of important over somewhat important is 1.11 (95% CI: 0.73–1.69), and the odds ratio of very important over important is 1.09 (95% CI: 0.81–1.49) — adjusted for importance of grades to friends, report card grades, and grades' importance. This again indicates that increases in grades' importance are not associated with changes in self-worth, adjusted for the frequency of requests for deeper understanding in history and report card grades. The odds ratio of D's and above over F's is 2.66 (95% CI: 1.25–5.59), the odds ratio of C's and above over D's and below is 0.83 (95% CI: 0.44–1.59), the odds ratio of B's and above over C's and below is 1.05 (95% CI: 0.66–1.66), and the odds ratio of A's over B's and below is 0.85 (95% CI: 0.63–1.15), adjusted for identities and grades' importance. This again indicates that having at least D's or higher is associated with an increase in self-worth, but other relations are statistically insignificant.
The frequency of requests for deeper understanding in history class was somewhat significant: the odds ratio of “less than once a week” over “never” is 1.64 (95% CI: 1.27–2.13), the odds ratio of “once a week” over “less than once a week” is 1.15 (95% CI: 0.90–1.49), the odds ratio of “a few times a week” over “once a week” is 1.04 (95% CI: 0.81–1.34), the odds ratio of “everyday” over “a few times a week” is 1.01 (95% CI: 0.79–1.29) — adjusted for report card grades and grades' importance. This indicates that any frequency of asking for deeper understanding is associated with an increase in self-worth, but the relations between frequencies greater than “never” are statistically insignificant.
Discussion
A positive association between grades and self-worth would be generally in line with previous literature (Richardson 2012, Lane et al 2004, Marsh & Martin 2011). Achievement and self-worth being positively related appears almost self-evident. However, although an association appeared, it was not statistically significant. The positive association between emphasis on grades and self-worth has no precedent in previous literature, which has not extensively studied it. One possible explanation is that those who have greater self-worth have the mental energy to focus on external goals like grades. Another is that placing emphasis on academic achievement provides students with purpose that also has a positive effect on their self-image.
The lower self-worth of girls as compared to boys is consistent with previous research (Pomerantz et al 2002), as is the higher self-worth of blacks as compared to whites when controlled for academic achievement (Lay & Wakstein 1985). The positive association between parent expectations and self-worth is also consistent with previous research (Martin et al 2007). The positive association of friends' values with self-worth is contrary to previous research, which shows a negative association with self-worth when controlled for academic achievement (Wouters et al 2013). A possible explanation is that surrounding oneself with good influences leads to better self-image; another is the converse.
The outcome variable and the main predictor variables were heavily skewed. The low sample size of students at the tails could impact the validity of the model. Although the report card grades were skewed towards higher grades, the significant results tended to be at the other extreme end, on the F–D boundary. Other variables face this problem. Family expecting the best of the respondent is also skewed in favor of yes. Native Americans only make 2% of the sample. This is not to say it was an omnipresent issue; other variables, like frequency of requests for deeper understanding in history class and community economic class, were relatively evenly distributed or otherwise unskewed.
It was initially expected that grades' importance and report card grades would interact significantly. Despite a potential association observed when viewing plots, an interaction term was never actually statistically significant — though it came close, especially in the reduced identity-accounted model.
Entering the frequency of requests for deeper understanding of course material was anticipated to strengthen the relationship between grades' importance, since grades being correlated with greater understanding would ostensibly reduce academic alienation and improve self-image. This was demonstrated in the reduced model. It is interesting that history was the subject that survived the reduction of this model. Perhaps this is because history, especially when taught at a shallow level, is stereotypically considered less applicable to “real life” than other subjects, like the sciences.
Conclusion
There is not conclusive evidence to conclude whether importance placed on grades is associated with self-esteem among secondary school students. There is evidence to conclude that non-failing grades are associated with an increase in self-esteem among secondary school students; further increases in self-worth by letter grade were not statistically significant. External pressures were most helpful in aiding prediction, followed by identities, in turn followed by frequency of deeper understanding requests. Although self-worth's association with importance placed on good grades was not statistically significant and the association with good grades was only partially statistically significant, the coefficients alone illustrated a potential association that could be revealed through further research or analysis. Such further analysis would contribute to the understanding of what could potentially bolster self-esteem among secondary school students, aiding to center the well-being of students rather than simply their output.
References
Forsyth, Donelson R., et al. “Attempting to Improve the Academic Performance of Struggling College Students by Bolstering Their Self–Esteem: An Intervention That Backfired.” Journal of Social and Clinical Psychology, vol. 26, no. 4, 2007, pp. 447–459., https://doi.org/10.1521/jscp.2007.26.4.447.
Lane, John, et al. “Self-Efficacy, Self-Esteem and Their Impact on Academic Performance.” Social Behavior and Personality: an International Journal, vol. 32, no. 3, 2004, pp. 247–256., https://doi.org/10.2224/sbp.2004.32.3.247.
Lay, Robert, and Julie Wakstein. “Race, Academic Achievement, and Self-Concept of Ability.” Research in Higher Education, vol. 22, no. 1, Mar. 1985, pp. 43–64., https://doi.org/10.1007/bf00992397.
Marsh, Herbert W., and Andrew J. Martin. “Academic Self-Concept and Academic Achievement: Relations and Causal Ordering.” British Journal of Educational Psychology, vol. 81, no. 1, 2011, pp. 59–77., https://doi.org/10.1348/000709910x503501.
Marsh, Herbert W, et al. “Subject-Specific Components of Academic Self-Concept and Self-Efficacy.” Contemporary Educational Psychology, vol. 16, no. 4, 1991, pp. 331–345., https://doi.org/10.1016/0361-476x(91)90013-b.
Martin, Andrew J., et al. “Getting Along with Teachers and Parents: The Yields of Good Relationships for Students' Achievement Motivation and Self-Esteem.” Journal of Psychologists and Counsellors in Schools, vol. 17, no. 2, 2007, pp. 109–125., doi:10.1375/ajgc.17.2.109.
Muijs, R. Daniel. “Predictors of Academic Achievement and Academic Self-Concept: A Longitudinal Perspective.” British Journal of Educational Psychology, vol. 67, no. 3, 1997, pp. 263–277., https://doi.org/10.1111/j.2044-8279.1997.tb01243.x.
Pomerantz, Eva M., et al. “Making the Grade but Feeling Distressed: Gender Differences in Academic Performance and Internal Distress.” Journal of Educational Psychology, vol. 94, no. 2, 2002, pp. 396–404., https://doi.org/10.1037/0022-0663.94.2.396.
Richardson, Michelle et al. “Psychological correlates of university students' academic performance: a systematic review and meta-analysis.” Psychological Bulletin, vol. 138,2 (2012): 353-87. doi:10.1037/a0026838
Schneider, Barbara. Sloan Study of Youth and Social Development, 1992-1997 [United States]. Inter-university Consortium for Political and Social Research [distributor], 2013-10-22. https://doi.org/10.3886/ICPSR04551.v2
Thompson, Ted. “Self-worth Protection: Review and Implications for the Classroom.” Educational Review, vol. 46, no. 3, 1994, pp. 259–274., https://doi.org/10.1080/0013191940460304.
Wouters, Sofie, et al. “Early Adolescents' Academic Self-Concept Formation: Do Classmates or Friends Matter Most?” Learning and Individual Differences, vol. 27, 2013, pp. 193–200., https://doi.org/10.1016/j.lindif.2013.09.002.